A Gaussian Mixture Hidden Markov Model for the VIX
Hidden Markov Models is a method belonging to Machine Learning used in many applications. There are many articles on the web on this topic and we are writing up our research results on this topic so we will only highlight a couple of excerpts from that.
We are building a model to predict volatility regimes of the VIX in order to dynamically allocate an investment portfolio to beat a simple buy-and-hold strategy and reduce the drawdown at the same time.
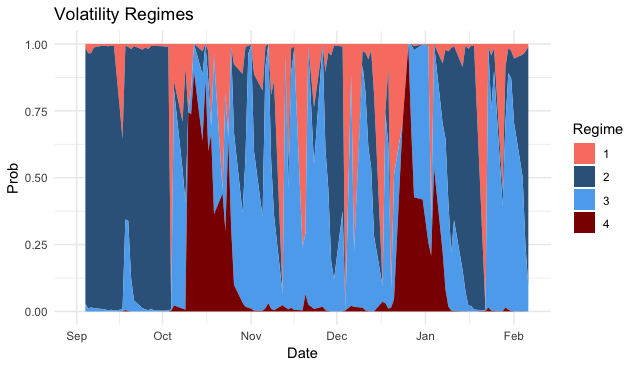
The Hidden Markov Model is able to recognize and model regimes. Here is a plot of the volatility regimes of the VIX from 2018/2019 yearend. You see it recognizes the October selloff and the December selloff period very well.

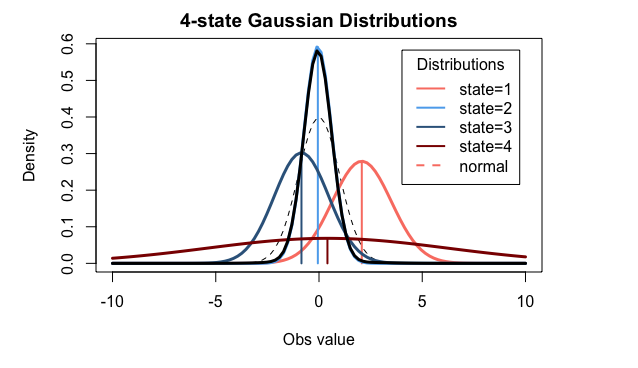
The 4 states/regimes in this chart above correspond to the 4 normal distributions making up the mixed normal distribution to model the data. Here is a plot of the corresponding normal distributions.

You can see from this there are 2 normal distributions (1, 4) which have a positive mean and 2 distributions with a negative mean (2,3). These belong to the overall bear and bull case respectively. Afterall if you expect a positive increase in the VIX you will expect to see a selloff in the S&P500, likewise if you expect a decrease in the VIX you will expect a rise in the S&P500. For the bear case there is one (4) with a very big standard deviation, even though the mean is smaller than the bear case (1), this is because (4) is the panic mode in a very steep selloff. Correspondingly for the bull cases (2,3) you have one (3) with a more negative mean and a greater standard deviation than the other bull case (2). That means the distribution (3) is the strong bull case, bigger drops in VIX and bigger rises in S&P500. The case (2) is the case of a relaxed bull case with small decreases in VIX and smaller rises in S&P500.
These 4 regimes define the dynamic allocation regimes of a portfolio from being aggressively bullish, conservatively bullish, strongly bearish and tempered bearish.
A Hidden Markov Model (HMM) is used to model the VIX (the Cboe Volatility Index). A 4-state Gaussian mixture is fitted to the VIX price history from 1990 to 2022. Using a growing window of training data, the price of the S&P500 is predicted and two trading algorithmsare presented, based on the expected mean and standard deviation as well as the predicted state probabilities. The performance of these strategies is analyzed on the full data-set and compared to the results of a data-set of half the size. The strategies are compared to both a buy-n-hold strategy of the same period and the VXTH (the Cboe VIXTail Hedge Index). The results presented here show promising application in modelling and predicting volatility, as well as identifying current volatility regimes predominating the market.
Continue reading the full article published on ResearchGate below: