HILO Index
The HILO Index is the difference between the number of new highs and new lows per day.
HILO (t) = New Highs (t) - New Lows (t)
It is shown as a blue curve on the screen below. We also plot the 20 day moving average (yellow) and a 100 day moving average together with one standard deviation added (red) and subtracted (red). The 100 day moving average + 1 standard deviation represents the upper bound and characterizes a very bullish market (68.2% of all cases are below this upper bound), likewise the 100 day moving average - 1 standard deviation represents the lower bound and characterizes a very bearish market (68.2% of all cases are above this lower bound).
The 20 day moving average together with the blue raw data present a way to gauge whether we are in a bullish market (green) or in a bearish market (red). We suggest that contrarian entry points are points at which these upper and lower bounds are breached. In other words, when we have more than 1 standard deviation from the mean we are more likely successful at betting on a market reversal.
Notice for instance in this chart the impending selloff in december 2018 and the onset in September 2018 with its peak around early January 2019. You notice that you have even the 10 day moving average breach the lower bound and the raw data breaching the lower bound by multiples of one standard deviation, ie. likelihoods of less than 0.001%.
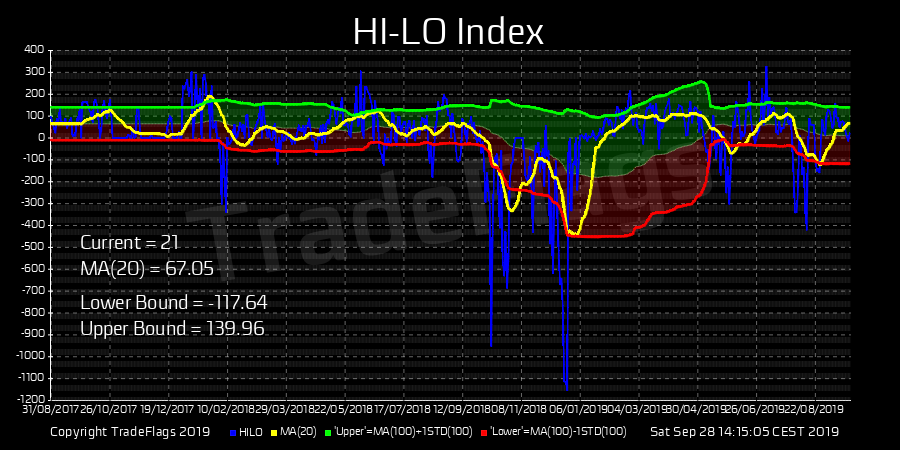
Chart of the HILO Index showing the daily new high minus new lows (blue), the 10 day moving average and a 100 day moving average with one standard deivation above (green) and below (red).