Levermann Score
Susan Levermann (Wiki) developed this strategy working as a Fund Manager at DWS managing the DWS Provesta fund with 1.7 billion USD value, across German and European stocks. In 2008 she was awarded "Best Fund Manager" 1- and 3 years running and later published the successful strategy in her book
"Der Entspannte Weg zum Reichtum"
which would translate to
"The relaxed path to wealth".
The book was awarded with the german book award in finance in 2011 (Finanzbuchpreis).
In an interview [2] she has postulated that
"A successful trader is not the one reading the stockprices in the morning brushing his teeth, nervously staring at the screens 24h and yelling at his mobile phone. It is by far more important to learn how to control your emotions and be disciplined..."
While other traders at DWS were frantically searching through the news and figuring out the state of the market, she was running her calculations on her database of around 3000 names and had time for a lot of coffee breaks [2].
Since Levermann's strategy yields Buy as well as Sell recommendations -
this 13-score system can be regarded as a quantitative arbitrage strategy.
Since it became popular many traders have started using it. For example, the biggest fund (sorted by AUM) on the german investment platform (Wikifolio) is using this strategy across german names only. There are other online services which offer Levermann notifications either as paid subscriptions or only for certain limited regions.
In contrast we offer the Levermann strategy for all regions globally for free!.
The scoring system
Here is a quick summary of the 13 points, which look similar in parts to the Piotroski F-Score, but Susan's list is more extensive since it includes performance comparisons.
| L | Metric\Score | +1 | 0 | -1 |
| 1 | RoE | >20% | [10%,20%] | <10% |
| 2 | EBIT Margin | >12% | [6%,12%] | <6% |
| 3 | Capital Ratio | >25% | [15%,25%] | <15% |
| 4 | PE avg (5y) | <12 | [12,16] | >16 |
| 5 | PE | <12 | [12,16] | >16 |
| 6 | Analyst Ratings | Sell (2.5 bis 3.0) | Hold (1.51 bis 2.49) | Buy (1.0 bis 1.5) |
| 7 | Reaction to Quarterly Earnings | positive | between -1% and +1% | negative |
| 8 | Earnings Revisions | increasing | between -5% and +5% | falling |
| 9 | Price today vs Price 6 months ago | increasing | between -5% and +5% | falling |
| 10 | Price today vs Price 1 year ago | increasing | between -5% and +5% | dropping |
| 11 | Momentum increase | row 9: 1 & row 10: 0 or -1 | else | row 9: -1 & row 10: 0 or 1 |
| 12 | 3-Month Reversal | Performance each month < Index | else | Performance each month > Index |
| 13 | Earnings Growth | EPS < EPS+1Y | between -5% and +5% | EPS > EPS+1Y |
The scoring is calculated based on the table above and then summed up over every stock. If a stock doesnt have a score for a particular value we value this score with the worst-case-scenario in order to be conservative, meaning -1 for that particular score. This makes sense for the Buys. For the Sells this doesn't make sense and we ignore those names where we don't have a full set of 13 scores, in order to be conservative.
We then filter for the Top10 by Score and Market Capitalisation (MarketCap) and separate them according to Market Capitalization. There are 6 in total (Mega-, Big-, Mid-, Small-, Micro- and NanoCaps). There are therefore 6x2 =12 possible signals per week with a list of max 10 names each for buy & sell. So a total of max 120 names per week to buy or sell.
When to buy or sell?
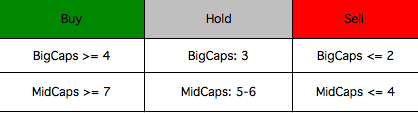
The scoring determines whether you get a Buy or Sell signal for the stock and one differentiates between two market capitalizations, greater and smaller than MidCaps.
For Mega- & BigCaps a stock is bought if the Levermann Score is >= 4 and sold if it is <=2.
For Mid-, Small-, Micro and NanoCaps a stock is bought if the Levermann Score is >=7 and sold if it is <=4. In between it is a Hold.
We define the market capitalizations the same as for the Graham Growth signals.
- MegaCap: . . . . . . . . . 300 bn $ ≤ MarketCap
- BigCap: . . . . . . . . . . . . 10 bn $ ≤ MarketCap < 300 bn $
- MidCap: . . . . . . . . . . . . .2 bn $ ≤ MarketCap < 10 bn $
- SmallCap: . . . . . . . . . .300 m $ ≤ MarketCap < 2bn $
- MicroCap: . . . . . . . . . . .50 m $ ≤ MarketCap < 300 m $
- NanoCap: . . . . . . . . . . . . . . . . . . . .MarketCap < 50 m $
We sort both the Levermann Score Buy & Sells by MarketCap descending.