The McClellan Oscillator (MCCO)
The McClellan Oscillator was developed by Sherman and Marian McClellan in 1969. It is based on the Advanced-Decline-Line (ADL).
The ADL is the difference between the number of rising and falling underliers on that day. When the difference is positive ADL gets added and subtracted otherwise. A rising ADL is a bullish sign and a falling ADL a bearish sign.
When a market is trending up and forming a top, the number of rising underliers should have already decreased. This means the ADL reaches its peak before the actual peak. This early warning sign is more pronounced the more underliers are involved in the calculation.
Traditionally only US underliers like the components of the S&P500 and DJIA are commonly used. We look at this as well, but we want to differentiate between 3 other important regions.
- US
- Europe
- Asia
- Global (which is US+Europe+Asia)
ADL = COUNT(UL_UP)-COUNT(UL_DOWN)
ADL(TODAY) = ADL(TODAY-1)+ADL0
The McClellan Oscillator takes these differences and uses an Exponential-Moving-Average (EMA) to smooth out the results.
It uses two different ranges for the EMA to mimick the behaviour of crossing Moving Averages and originally corresponds to a 5% and 10% change in ADL. The MCCO is regarded as a Momentum Oscillator.
MCCO = EMA_19(ADL) - EMA_39(ADL)
The EMA is defined as
EMA(TODAY) = ADL(TODAY)*K + EMA(TODAY-1)*(1-K)
where K = 2/(N+1) and N=19 or 39.
Interesting for the Oscillator is when it crosses through zero. This is what we monitor and flag. When the MCCO crosses into positive or negative territory. A positive cross is bullish and a negative cross is bearish.
When the MCCO bounces around zero for longer periods we expect a dynamic move, breakout, in either one direction.
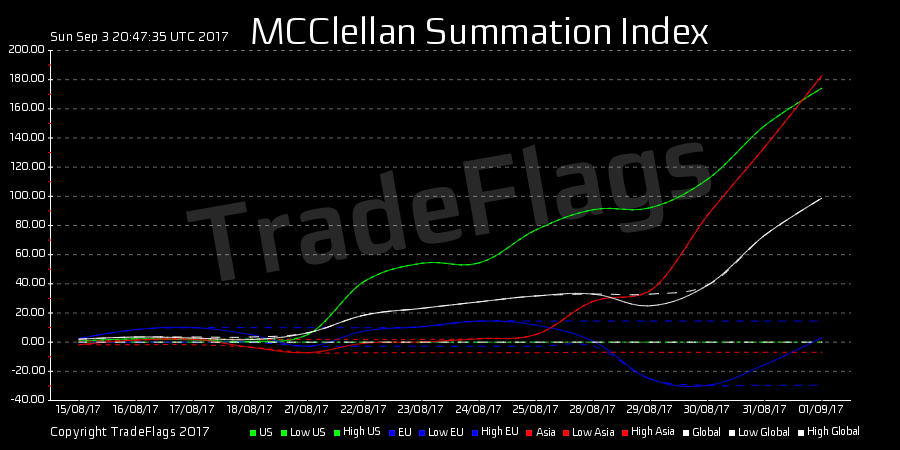
The McClellan Summation Index (MCC_SI)
The Summation Index is defined as
MCC_SI(TODAY) = MCC_SI(TODAY-1) + MCCO
Interesting levels over time are the MCC_SI_MAX and MIN in comparison to the running MCC_SI. When the running MCC_SI approaches the MCC_SI_MAX or MIN we have a sign of an overbought or oversold market.
We monitor this in a daily summary like this example
McClellan Summation Index
US: -1250 : 344 : 1400
Asia: -200 : 100 : 450
EU: -1200 : 500 : 1800
Global: -3500 : -250 : 3900
The MCC_SI is used to recognize an overall bullish or bearish market. If it is negative we are in bearish territory, if it is positive we are in a bullish territory. Similarly the MAX and MIN levels are of interest to give an overall measure of bullishness and bearishness and enable comparison to past extremes. Some trading platforms or magazines call such indicator a traffic light in order to make it simple to the laymen. If the traffic light has turned 'green' it is ok to buy stocks. If the traffic light has turned 'red' it is not recommended to buy stocks, or to buy stocks with care.
Global, US, Asia, Europe
Links: