TRADEFLAGS Q-HUB
Decode the Noise.
Trade the Convergence.
Quantum-level synthesis of Fundamentals, Technicals, Sentiment, Breadth, and Options. We generate high-conviction signals when the models agree.
Access the SwarmRisk Gauges NEW
ADS Business Conditions Index
Aruoba-Diebold-Scotti real-time daily US economic conditions tracker — Philadelphia Fed.
VIX / VIX3M Ratio
Inverse volatility timing signal — ratio of 1-month VIX to 3-month VIX3M implied vol. Exit short vol at 0.917.
CSTE — Caesarstone
B/M: 4.20 • Small-cap stone surfaces. Top Piotroski pick with perfect fundamentals.
SNBR — Sleep Number
B/M: 9.79 • Micro-cap mattress retailer with strong operational turnaround.
GCO — Genesco
B/M: 1.78 • Footwear & apparel retailer. Improving profitability and margins.
MTW — Manitowoc
B/M: 1.51 • Crane manufacturer. Strong ROA improvement from deep distress.
HAIN — Hain Celestial
B/M: 29.70 • Organic food. Extreme undervaluation with improving fundamentals.
Unicorn Growth NEW
 AI + Finance
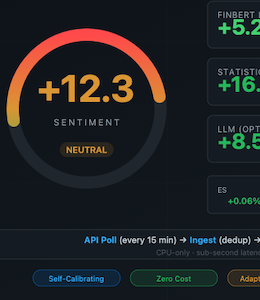
Hybrid News Sentiment Engine: Real-Time Market Analysis via Adaptive Ensemble Learning
An ultra-fast self-learning sentiment analysis workflow without having to retrain any LLM models.
 AI + Finance
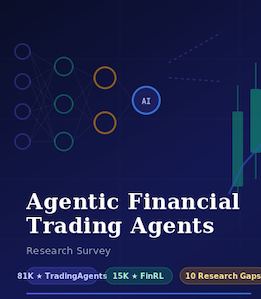
Agentic Financial Trading Agents: A Comprehensive Literature and Research Survey
Overview of current agentic trading in finance.
 Machine Learning
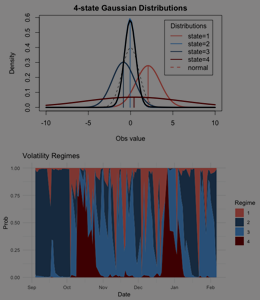
A Gaussian Mixture Hidden Markov Model for the VIX
A Hidden Markov Model (HMM) is used to model the VIX (the Cboe Volatility Index).
 Crypto
UNISWAP: Impermanent Loss and Risk Profile of a Liquidity Provider
UNISWAP is a decentralized exchange (DEX) and part of an ecosystem of products in decentralized finance (DeFi).
 Fundamental
Startup & Unicorn Growth Valuation
How do you value companies which have IPOed recently?

 Technical
The Power of Growth Stocks
Feature Article in the Magazine: Technical Analysis of Stocks & Commodities
 Technical
Trend Trading Explained
It's a mechanical trading rule used by many day traders and long term investors.
 Technical
The Philosophy of Trend Following
Trend following is common sense and we use it without knowing daily in our lives.
 Fundamental
Graham's Formula for Valuing Growth Stocks
Explained: Benjamin Graham's formula to forecast the future value of a company based on its earnings history and growth forecasts.
 Technical
Hindenburg Omen
The Hindenburg Omen predicted the crash of 1987 and also triggered many times before the crash of the great financial crisis (GFC) in 2008.
 Fundamental
Piotroski F-Score
Piotroski only looks at stocks in the lowest third of the market cap population and the highest fifth of the book-to-market population.
 Technical
The Arms Index
If the market were a wristwatch, it would be divided into shares, not hours. (Richard Arms)
 Technical
The $Arms Index ($TRIN)
Based on the analysis of the conventional Arms Index (TRIN) calculation we have deduced an improved version of the TRIN, which we showcase here.
Technical
McClellan Oscillator & Summation Index
The McClellan Oscillator was developed by Sherman and Marian McClellan in 1969. It is based on the Advanced-Decline-Line (ADL).
Technical
HILO Index
The HILO Index is the difference between the number of new highs and new lows per day
Technical
TD Buy & Sell Perfection
This indicator is a signal for a trend exhaustion. It signals when an underlier is oversold or overbought.
 Technical
Fibonacci Retracements
If people trade w.r.t Fibonacci or whether subconsciously the golden ratio affects the objectivity of the people trading is still open for debate.
 Fundamental
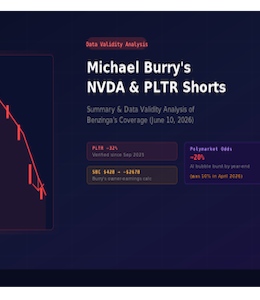
Michael Burry's AI Shorts — Summary & Data Validity Analysis
A critical analysis of Michael Burry's NVDA and PLTR short positions, with data validity checks on stock prices, Polymarket odds, and stock-based compensation claims.
Features
The Algorithm
Machine-learning, AI powered algorithm calibrated using 7mio+ data points. In excess of 100%+ average annualized returns
Technical & Fundamental
Curated technical & fundamental indicators based on research, backtested and calibrated.
News & Market Snaps
Headlines with snapped future prices at time of publication. Taking algorithmic trading to the limit.
Growth & Unicorn Modeling
Growth models based on balance sheets and published SEC documents.

Descriptions
There are many variations of passages of Lorem Ipsum available, but the majority have suffered alteration in some form, by injected humour.
- Creator
- Collection
- Owner
-
Year created
2021